Strategy Tester Report
AlpariUK-Demo (Build 225)
| Symbol | EURUSD (Euro vs US Dollar) | ||||
| Period | 1 Hour (H1) 2009.08.03 01:00 - 2009.10.01 00:00 (2009.08.01 - 2009.10.01) | ||||
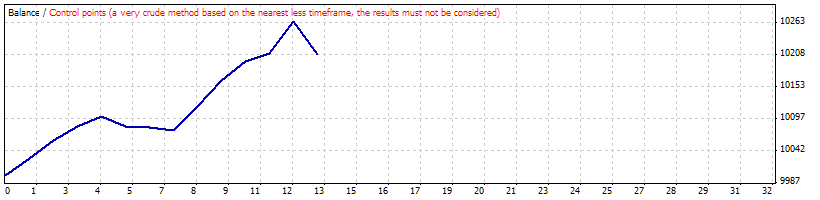
| Model | Control points (a very crude method, the results must not be considered) | ||||
| Parameters | MagicNumber=0; SignalMail=false; EachTickMode=false; Lots=0.1; Slippage=3; StopLossMode=false; StopLoss=60; TakeProfitMode=false; TakeProfit=200; TrailingStopMode=false; TrailingStop=50; | ||||
| Bars in test | 1124 | Ticks modelled | 25909 | Modelling quality | n/a |
| Mismatched charts errors | 7 | ||||
| Initial deposit | 10000.00 | ||||
| Total net profit | 209.55 | Gross profit | 290.15 | Gross loss | -80.60 |
| Profit factor | 3.60 | Expected payoff | 16.12 | ||
| Absolute drawdown | 43.50 | Maximal drawdown | 107.10 (1.04%) | Relative drawdown | 1.04% (107.10) |
| Total trades | 13 | Short positions (won %) | 6 (66.67%) | Long positions (won %) | 7 (71.43%) |
| Profit trades (% of total) | 9 (69.23%) | Loss trades (% of total) | 4 (30.77%) | ||
| Largest | profit trade | 55.40 | loss trade | -56.70 | |
| Average | profit trade | 32.24 | loss trade | -20.15 | |
| Maximum | consecutive wins (profit in money) | 5 (188.05) | consecutive losses (loss in money) | 3 (-23.90) | |
| Maximal | consecutive profit (count of wins) | 188.05 (5) | consecutive loss (count of losses) | -56.70 (1) | |
| Average | consecutive wins | 5 | consecutive losses | 2 | |
| # | Time | Type | Order | Size | Price | S / L | T / P | Profit | Balance |
| 1 | 2009.08.03 05:00 | buy | 1 | 0.10 | 1.42495 | 0.00000 | 0.00000 | ||
| 2 | 2009.08.03 12:00 | close | 1 | 0.10 | 1.42778 | 0.00000 | 0.00000 | 28.30 | 10028.30 |
| 3 | 2009.08.05 08:00 | buy | 2 | 0.10 | 1.43840 | 0.00000 | 0.00000 | ||
| 4 | 2009.08.05 14:00 | close | 2 | 0.10 | 1.44163 | 0.00000 | 0.00000 | 32.30 | 10060.60 |
| 5 | 2009.08.10 03:00 | sell | 3 | 0.10 | 1.42010 | 0.00000 | 0.00000 | ||
| 6 | 2009.08.10 15:00 | close | 3 | 0.10 | 1.41768 | 0.00000 | 0.00000 | 24.20 | 10084.80 |
| 7 | 2009.08.11 00:00 | sell | 4 | 0.10 | 1.41450 | 0.00000 | 0.00000 | ||
| 8 | 2009.08.11 16:00 | close | 4 | 0.10 | 1.41277 | 0.00000 | 0.00000 | 17.30 | 10102.10 |
| 9 | 2009.08.17 20:00 | sell | 5 | 0.10 | 1.40883 | 0.00000 | 0.00000 | ||
| 10 | 2009.08.18 14:00 | close | 5 | 0.10 | 1.41060 | 0.00000 | 0.00000 | -17.80 | 10084.30 |
| 11 | 2009.08.20 00:00 | buy | 6 | 0.10 | 1.42346 | 0.00000 | 0.00000 | ||
| 12 | 2009.08.20 18:00 | close | 6 | 0.10 | 1.42338 | 0.00000 | 0.00000 | -0.80 | 10083.50 |
| 13 | 2009.08.24 07:00 | buy | 7 | 0.10 | 1.43345 | 0.00000 | 0.00000 | ||
| 14 | 2009.08.24 15:00 | close | 7 | 0.10 | 1.43292 | 0.00000 | 0.00000 | -5.30 | 10078.20 |
| 15 | 2009.08.28 10:00 | buy | 8 | 0.10 | 1.43315 | 0.00000 | 0.00000 | ||
| 16 | 2009.08.28 16:00 | close | 8 | 0.10 | 1.43731 | 0.00000 | 0.00000 | 41.60 | 10119.80 |
| 17 | 2009.09.08 23:00 | buy | 9 | 0.10 | 1.44779 | 0.00000 | 0.00000 | ||
| 18 | 2009.09.09 14:00 | close | 9 | 0.10 | 1.45216 | 0.00000 | 0.00000 | 43.65 | 10163.45 |
| 19 | 2009.09.17 01:00 | buy | 10 | 0.10 | 1.47047 | 0.00000 | 0.00000 | ||
| 20 | 2009.09.17 08:00 | close | 10 | 0.10 | 1.47376 | 0.00000 | 0.00000 | 32.90 | 10196.35 |
| 21 | 2009.09.29 01:00 | sell | 11 | 0.10 | 1.46279 | 0.00000 | 0.00000 | ||
| 22 | 2009.09.29 04:00 | close | 11 | 0.10 | 1.46134 | 0.00000 | 0.00000 | 14.50 | 10210.85 |
| 23 | 2009.09.29 07:00 | sell | 12 | 0.10 | 1.46336 | 0.00000 | 0.00000 | ||
| 24 | 2009.09.29 10:00 | close | 12 | 0.10 | 1.45782 | 0.00000 | 0.00000 | 55.40 | 10266.25 |
| 25 | 2009.09.29 20:00 | sell | 13 | 0.10 | 1.45806 | 0.00000 | 0.00000 | ||
| 26 | 2009.09.30 23:59 | close at stop | 13 | 0.10 | 1.46372 | 0.00000 | 0.00000 | -56.70 | 10209.55 |